 |
MapGeo | Quarterly NewsletterDecember 2025 |
This Quarter's MapGeo Community Spotlight |
 |
In April 2025, Edwards County officially became the latest member to join the CVCOG. Pictured here is downtown Rocksprings, which is representative of the clean, small town charm the region is known for. |
The Geographic Center of Texas |
Have you ever heard the phrase “deep in the heart of Texas” and wondered where exactly that might be? When it comes to laying claim to the actual heart of Texas, Concho Valley Council of Government (CVCOG), this quarter’s featured MapGeo customer, may have the strongest argument of them all. On the east side of the valley in McCulloch County, just outside of Brady, lies the actual geographic center of the State of Texas. Concho Valley is in fact, full of fantastic little towns like Brady. Many towns, like Brady, have their own municipal airports, lakes, golf courses, and swimming pools. With just a straight shot driving through Mesquite and prickly pear that's considered close by Texas standards, you will also find Concho Valley is also not too far from Austin.
Despite its proximity to Austin and even San Antonio, Concho Valley’s largest town San Angelo, or just “Angelo” as some locals call it, is one of the largest cities in Texas to be unserved by an interstate. This adds to Angelo's small town charm. San Angelo started as a classic western boomtown, and once grew to become what was known as the “wool and mohair capital of the world”. San Angelo is also a natural oasis, with a lush tree-lined river creating a sanctuary directly through the city and otherwise dry surroundings of the valley.
In a large and mostly sparse area like Concho Valley, CVCOG uses MapGeo to help with the challenge of 911 addressing. CVCOG’s MapGeo site incorporates every regional mile marker from each county in the council. This especially helps in rural areas locate and access 911 calls. CVCOG leverages MapGeo as the region’s public-facing parcel map as well as a tool to help residents find polling stations, including in Tom Green County, where San Angelo is located. |
Using the MapGeo Abutters Tool |
MapGeo enables users to analyze property relationships by selecting adjacent parcels or data within a customizable distance, such as assessing properties near schools or evaluating development impact areas. The Abutters Tool allows quick identification of property owners within a chosen buffer, with parcels easily added or removed directly on the map or list. Results can be displayed visually and exported as spreadsheets, mailing labels, or PDF reports, with outputs ranging from standard owner lists to more complex configurations used by communities like Taunton, MA. |
 |
Abutters results downloaded as mailing labels |
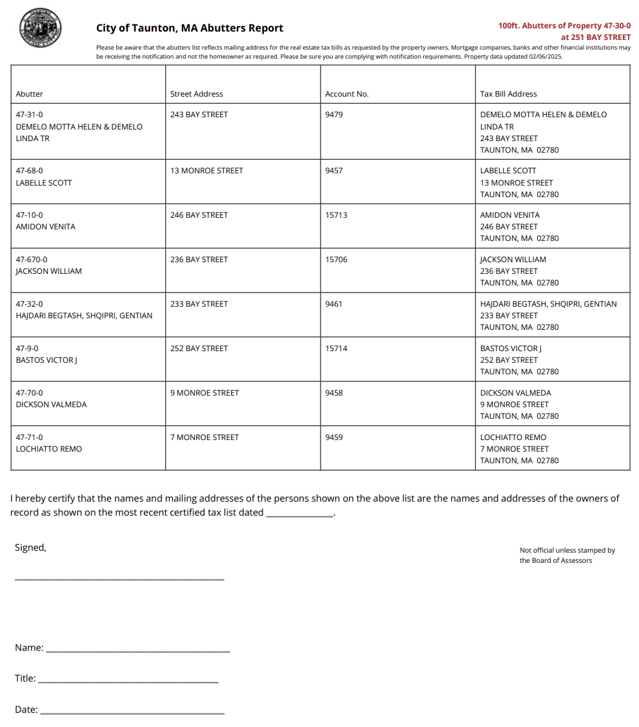 |
Taunton, MA's PDF Abutters Report |
The Use of Data Views on MapGeo |
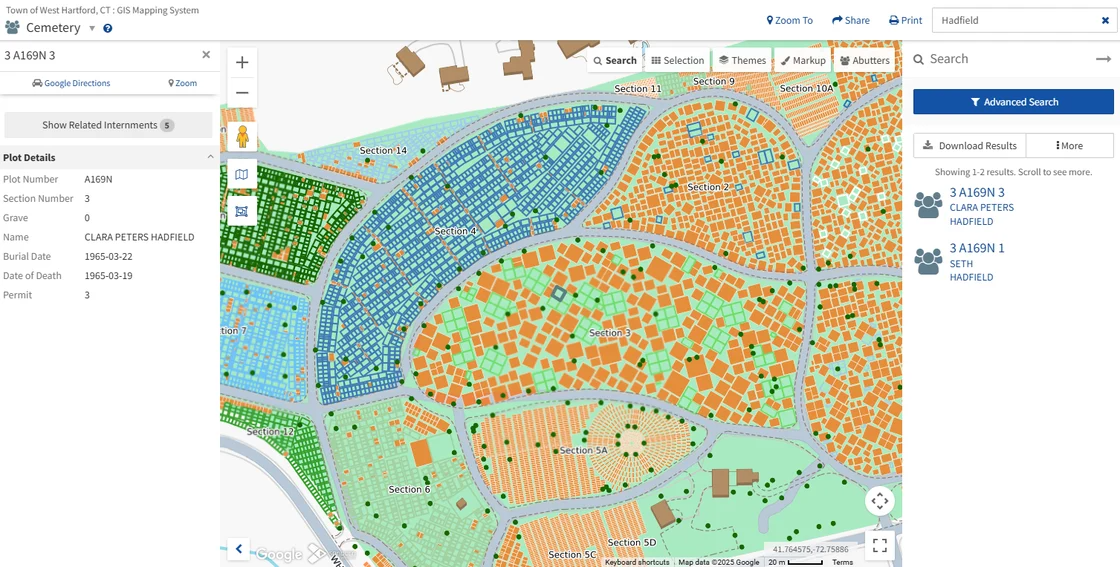
Most users are familiar with the traditional functionality of MapGeo where you can search for a property and get detailed information about that property in return. MapGeo can do more! Many of our clients have configured additional Data Views to focus on other data and information, such as cemeteries and utilities. These unique Data Views allow users to search on attributes other than owner name or parcel ID that are focused on those datasets. For the utility view, users can search for an asset ID or for an attribute about the asset such as pipe material. In the case of the cemetery view, users can search for the name or by death date. |
 |
Featured Webinar: A Guide to Mapping Your Lead Lines |
Back in October of 2023, we covered the EPA’s 2021 Federal Lead and Copper Rule Revisions (LCRR) right before the release of the 2024 Lead and Copper Rule Improvements (LCRI). Now it’s time for part 2! Join us as we cover what has changed in the world of Lead Service Reporting/Monitoring and how municipalities across the nation are tackling the challenges of mandated lead replacement, inventory management, and public outreach.
In this webinar, we will take you through how some local governments have utilized GIS to meet these challenges to better prepare for the LCRI compliance date of November 1st, 2027, and ensure that they meet the goal of complete Lead Service Removal by 2037. With support from GIS, Lead Service reporting can be managed in a far more efficient and effective manner. Dive deep with the Sanborn Geospatial team as we cover:
|
If you want to rewatch part 1, click here for the webinar recording. |
Budgeting Reminder |
For many of you, the most wonderful time of the year is upon us… Budgeting Season! Please reach out if you’d like an updated quote to support your budgeting process. Things to consider for an updated quote: add new themes, new Data Views, Oblique Analyst, CAMA Uploader, the Dashboard Uploader, or if you need general GIS support, we provide that too!
If you need some ideas on ways to increase your Spatial IQ – check out our help resources to see what others have been doing with GIS. Ideas for Expanding your GIS using MapGeo |
We would like to wish you a wonderful holiday season! |
Sincerely,
The Spatial IQ for MapGeo Team and the AppGeo Division at Sanborn
P.S. - Interested in having your city or county spotlighted in a MapGeo newsletter? Reply directly to this email to let us know. |
 |
|